
The most popular alcohol in the world is currently traded across every continent but most of it comes from the Americas. Ethanol, which you may also know as ethyl alcohol, grain alcohol or methyl carbinol (if you’re a nomenclature traditionalist), is an organic compound that has been harnessed for its myriad of uses since at least 7000 BC. Although mainly associated with intoxication and disinfection, ethanol gained popularity as a less carbon-intensive fuel in the USA and Brazil following the spike in oil prices during the in the 1970s oil crises and stock market crash.
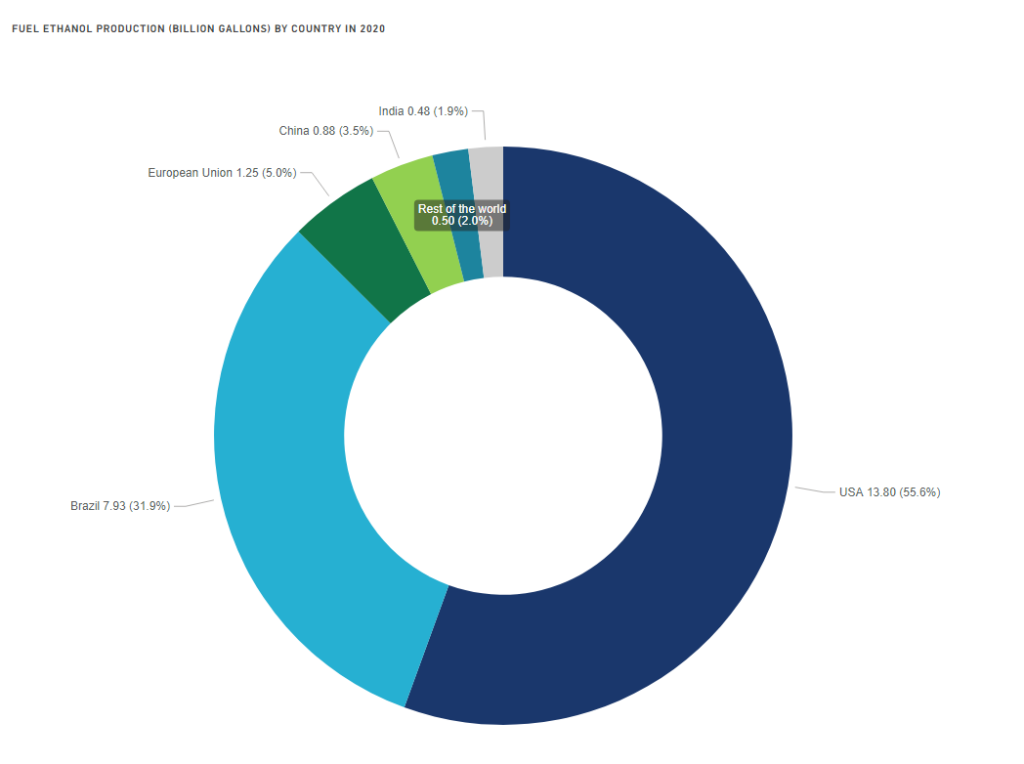
Today, American and Brazilian ethanol still dominate the global market: ethanol is now the primary fuel in Brazil, and most of the world’s ethanol is directed to fuel. Global ethanol production has been on the rise for several years and the global market is predicted to be worth $129.36 Billion US by 2027 based on a compound annual growth rate (CAGR) of 4.8%1. Much of the growth in the market has been driven by governmental mandates for renewable fuel.
Why the interest in ethanol derivative trading? Commodity Risk Management.
When researching ethanol trading opportunities, you will likely come across talk of ‘portfolio diversification’ but at Czarnikow we do things a little differently. We’ve been in the Brazilian sugar landscape for over 20 years and have developed an ethanol trading joint venture in Brazil, CZ Energy, which allows producers of sugarcane and corn derived ethanol to manage their market exposure using hedging tools. Mills can use derivatives to lock in the price of ethanol for their crop, therefore allowing them to secure returns and protect cash-flow generation. Whilst they will not be able to benefit from any rise in prices, they will be protected from any price decline. Once prices are securing satisfactory margins, it may be interesting to lock-in prices for a portion of the volume of ethanol available so a client can capture the upsides and manage the price of the remainder when necessary.
Brazilian ethanol is traded differently from sugar; sugar is mostly traded with futures whereas ethanol is mostly traded based on the spot price, which is why it is important to understand the relationship between the spot and forward price. When the spot price rises, the forward rate usually follows. Simply put, a rise in the current price of ethanol will cause the value and price of a forward contract to rise as well, though not by the same amount. Price risk management is especially important during the off-crop season.
CZ Energy also offers stock and carry for when the spot price is too low and unfavourable for producers; with this service, clients can store ethanol until the spot price rises again which usually happens in the off-crop period, allowing for better prices capture.
Speculating on the ethanol market
Traders with a bigger appetite for risk will opt to speculate on the market or trade in stocks. Speculators take a less conservative approach by assuming the position that ethanol prices will rise or fall, and buy or sell futures, respectively; the downside is that there is no guarantee of any certain profit margin. Fluctuations in ethanol and other energy fuels are what attracts speculators.
Price swings and parity: sugar and gasoline vs ethanol in Brazil
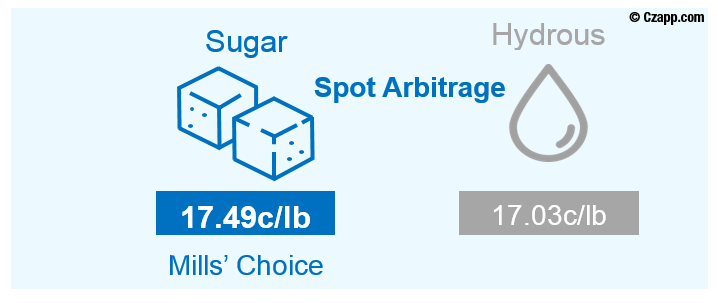
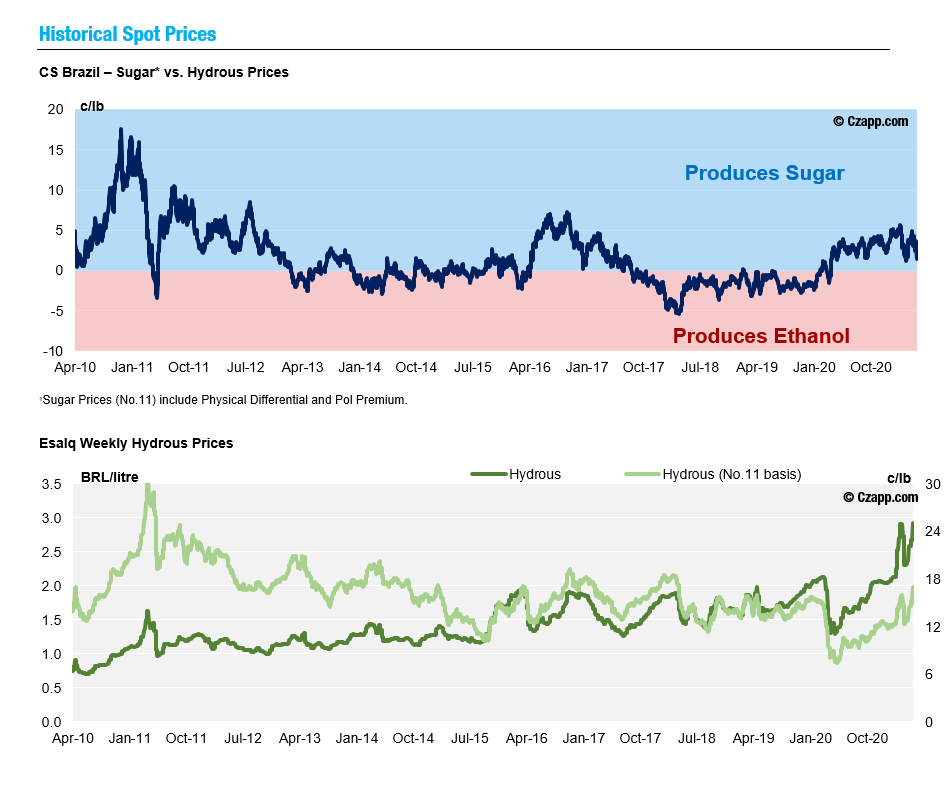
Participants in the Brazilian sugar market are constantly asking this question: “sugar or ethanol?” Sugar producers will make more ethanol if the sell price is higher than that of sugar and vice versa. This is a very simple explanation, so if you want all the details about the sugar-ethanol relationship you can find them in this post. Our analysts update the sugar-ethanol parity every week on Czapp.
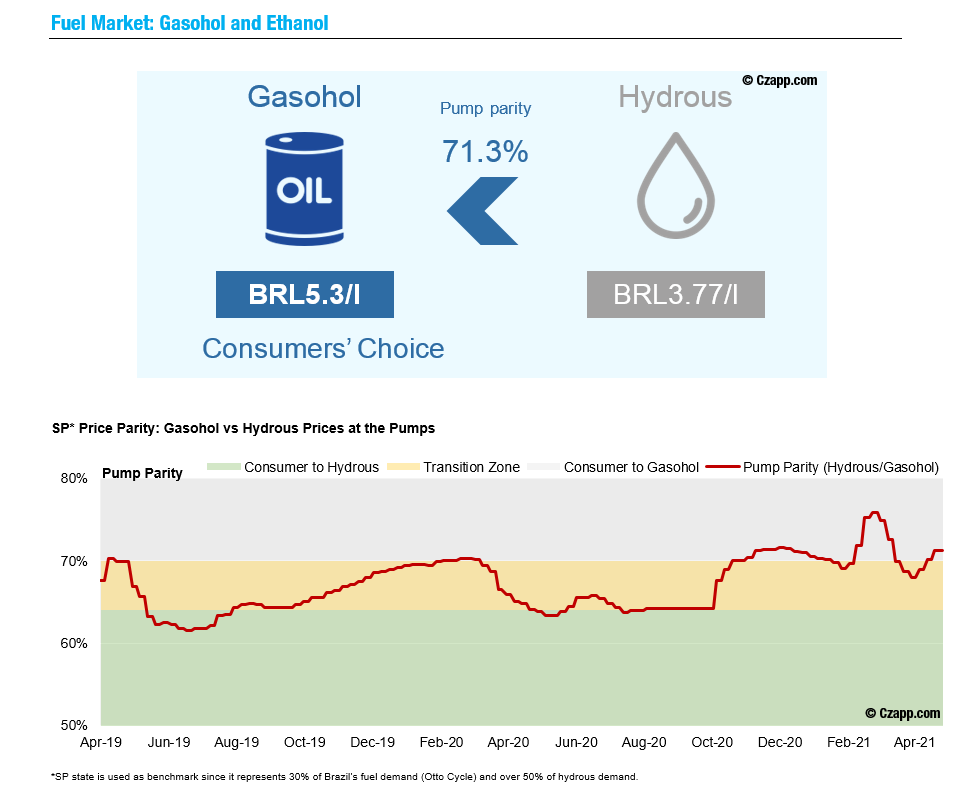
Now for the elephant in the room: the competition between gasohol and ethanol in Brazil. Currently the hydrous/gasohol (gasoline and anhydrous ethanol mix) parity is 70% which means that drivers will break even when hydrous ethanol is 70% of the price of gasoline because hydrous ethanol is about 30% less energy efficient than gasoline. Therefore, when hydrous prices equal 70% of gasohol prices, it doesn’t matter to the driver which fuel it is in their car because the price/km for gasohol and hydrous ethanol will be the same. If you’re wondering why we’re talking about gasohol, it’s because the Brazilian government requires that at least 27% of gasoline fuel be anhydrous ethanol.
How to trade renewable fuel credits in the USA
There is not much that the Brazilian and American ethanol markets have in common. Firstly, ethanol is mainly produced from corn in the US – about 95% – the rest is from sugarcane, sugar beet, and other grasses and trees. Most of the corn and ethanol is produced in the Midwest, a region comprised of 14 states, the largest producer being Iowa2. Secondly, commodity derivative trading is a small part of the ethanol trade in the US; but the ethanol futures activity that does happen is on the Chicago Board of Trade (CBOT). Instead, participants in the market use physical trading to capitalise on the differential in biofuel credits called ‘renewable identification numbers (RINs)’.
It all started in 2006 when the USA government introduced the Renewable Fuel Standard (RFS) Program that set a minimum requirement for the volume of renewable fuels what the country uses and mandates that gasoline must be blended to contain at least 10% ethanol, known as the E10 blend. The goal is for the US to use 36 million gallons of renewable fuel by 20223.
How are RINs generated and used?
- The production of renewable fuels like ethanol generates renewable identification numbers (RINs), the “currency” of the RFS.
- Buying or selling ethanol means buying or selling the RIN attached to it.
- An obligated buyer e.g. a refiner or importer buys the ethanol.
- The moment that ethanol is blended with gasoline or diesel (to contain anywhere between 10-83% anhydrous ethanol), the RIN is detached from the ethanol.
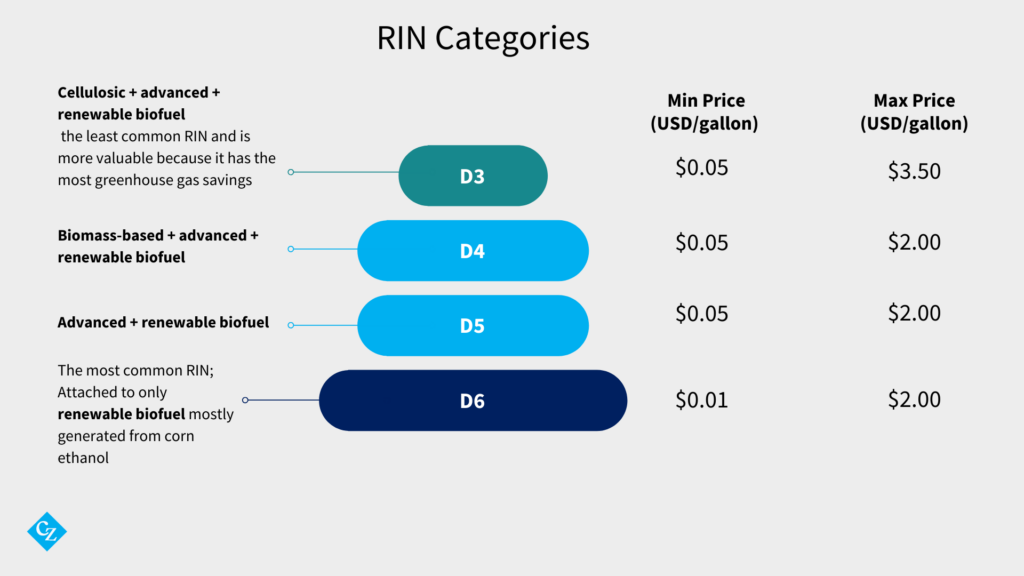
- RINs can then be traded independently by commodity trading houses or speculative traders. A RIN acts as a unique ID for each gallon of renewable fuel produced or imported in the US; each one is put into one of four categories and has its own price bounds (see below).
- A RIN can be bought or sold until it reaches the obligated party’s (refiner or importer) renewable volume obligations.
What are renewable volume obligations (RVOs)?
Renewable volume obligations (RVOs) represent the percentage of gasoline and diesel that must be blended with a renewable fuel. You can also think of it as the amount of biofuel that refiners, importers or any other obligated party in the trade must cover in one calendar year. RVOs are calculated using the refiner’s or importer’s actual supply of gasoline or diesel.
RVO = volume of each type of renewable fuel required in a given year / projected gasoline and diesel consumption for that year.
Each party can carry over up to 20% of the RINs they acquired in a year into the following year, to meet their RVO for that second year i.e., if you have 23% extra RINs in 2018, you can only use 20% of those RINs in 2019.
How to trade biofuel credits in Brazil
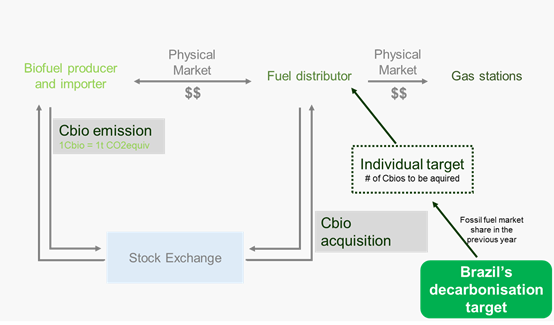
Brazil is changing up its ethanol trading scene with renewable fuel credits of its own. The RenovaBio Program is a policy that allows for the distribution of decarbonisation credits called CBios that can be traded on the B3 stock exchange. Each time a litre of ethanol is produced a CBio is emitted. 1CBio equates to 1tonne of CO2 not emitted, therefore annual CBio targets are dictated by the fossil fuel market share in Brazil. Unlike RINs, CBios do not expire.
Similar to the RFS, fuel distributors in Brazil must buy a certain amount of CBios every year. To sum it up: biofuel producers and importer gain CBios by generating renewable fuel and sell Cbios to generate extra revenue; Fuel distributors can buy and sell CBios on the B3 to meet their targets and make more money. 18.87m CBios traded on the B3 at the end of 2020 – 26.7% above the 2019 and 2020 targets combined4.
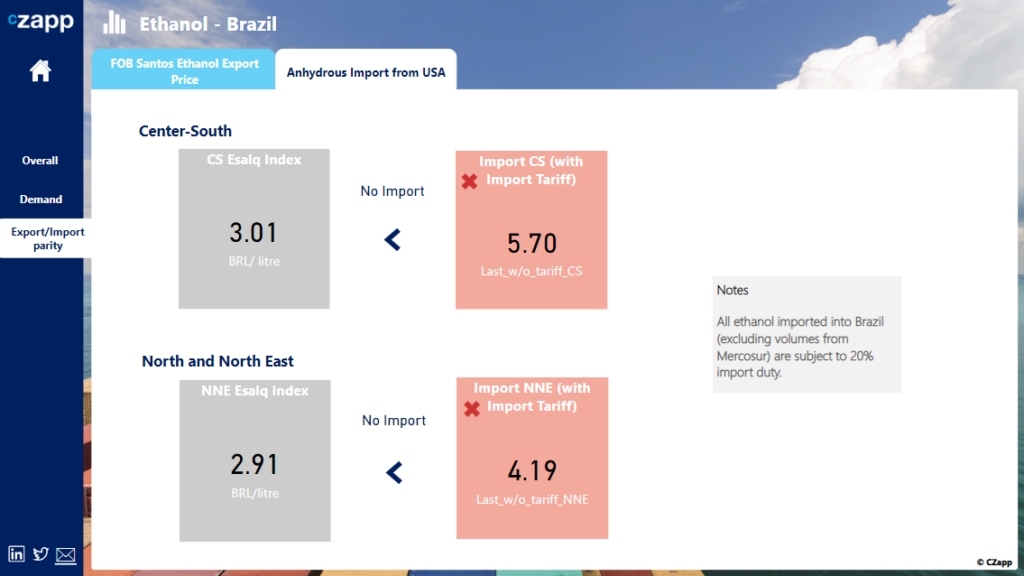
Ethanol Import-export parity: Brazil and the USA
Brazil exports around 5% of its ethanol every year, and though most of it goes to the USA and South Korea more of it is reaching the Philippines, the Netherlands and the UK. Brazil usually has to import ethanol from the US every year to meet its fuel demand and in December 2020 Brazil reinstated its 20% import tariff on volumes of US ethanol exceeding 750 million litres, causing a rift in their bilateral trade agreement5. Naturally this affects the viability of importing anhydrous ethanol from the US into Brazil. You can find out if importing or exporting ethanol is favourable in our interactive data section of Czapp.
How COVID-19 impacted the ethanol market in 2020
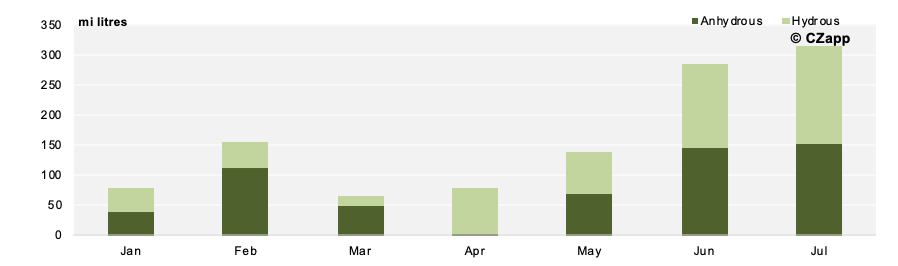
What happens when people stay at home to keep themselves and their communities safe? The prices of vehicle fuels drop. This is what happened to oil and ethanol in 2020. Even when restrictions were eased at various points in the year, lockdowns in some regions still caused major supply chain disruptions. Despite Brazil’s anhydrous and hydrous ethanol sales falling in the first quarter of 2020 because of reasons mentioned above, it exported more hydrous than it typically does because everyone was in dire need of hand sanitiser.
The US ethanol industry, on the other hand, had a sluggish start to the year because of losses in 2019 and seriously contracted by around 50% in March 2020 – quite the blow given that ethanol is almost 50% of US agricultural trade. Fortunately, the situation turned around when ethanol by-product prices rose.
History of the ethanol market
Emerging ethanol markets
Environmental consciousness is not the only thing driving global ethanol market growth. Let’s have a look at India, the second largest sugarcane producer in the world and a consistent surplus producer. India is very reliant on crude oil and must export its excess sugar with government subsidies. Instead of importing crude oil to meet its fuel demand India aims reach an E20 blend (20% ethanol, 80% gasoline) 2025. Currently India’s blend is 6.5%; to meet its target, it must produce almost three times the ethanol it does now every year. To learn more about India’s ethanol industry, check our Czapp Explainers.
Brazil is also making some interesting moves by increasing its corn ethanol output. There are currently 16 corn ethanol plants in the logistically challenged Centre-West region compared to the roughly 350 sugarcane ethanol plants concentrated in Centre-South Brazil. However, Brazilian corn ethanol could reach 5.5 billion litres per year if current projects go to plan6.
Takeaways
- Czarnikow is offering ethanol hedging in Brazil to manage producers’ market exposure
- Both the USA and Brazil use biofuel credits to incentivise biofuel production but credits are more important in the USA.
- You can keep up with ethanol parity in Brazil and other related news on Czapp – our analysis app.
If you found this post useful, share it on Facebook, Twitter and Linkein.
Looking to trade energy products?
Sources
- Bloomberg, 2020, Ethanol Market Size Worth $129.36 Billion by 2027 | CAGR 4.8%: Grand View Research, Inc.
- Renewable Fuels Association, 2021, Where Is Ethanol Made?
- United States Energy Information Agency, 2013, RINs and RVOs are used to implement the Renewable Fuel Standard
- S&P Global Platts, 2020, Brazilian carbon credit first trade at near $10/CBIO
- Agrinews, 2020, Brazil reinstates tariffs on U.S. ethanol
- USDA Foreign Agricultural Services, 2020, GAIN Report: Corn Ethanol Production Booms in Brazil